Information on the 4EvAirSense
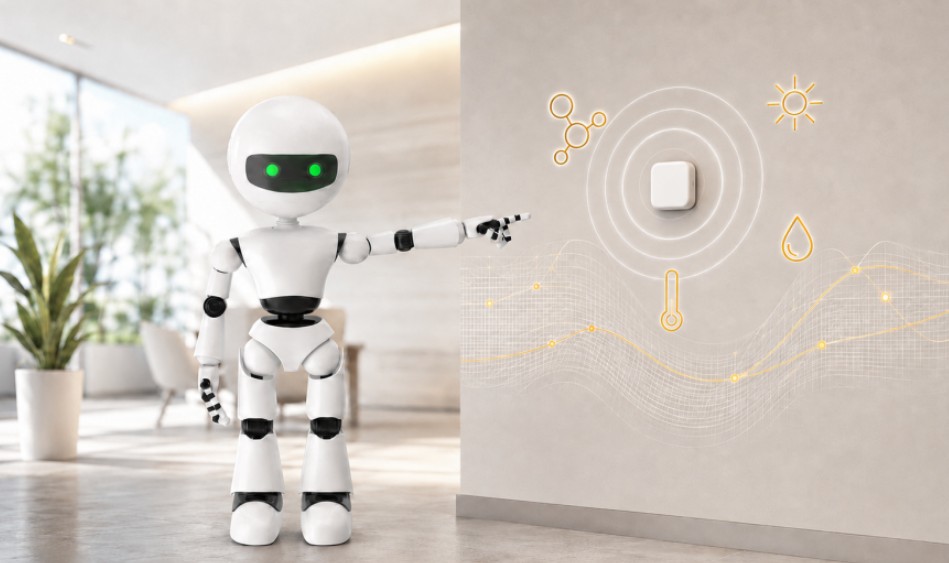
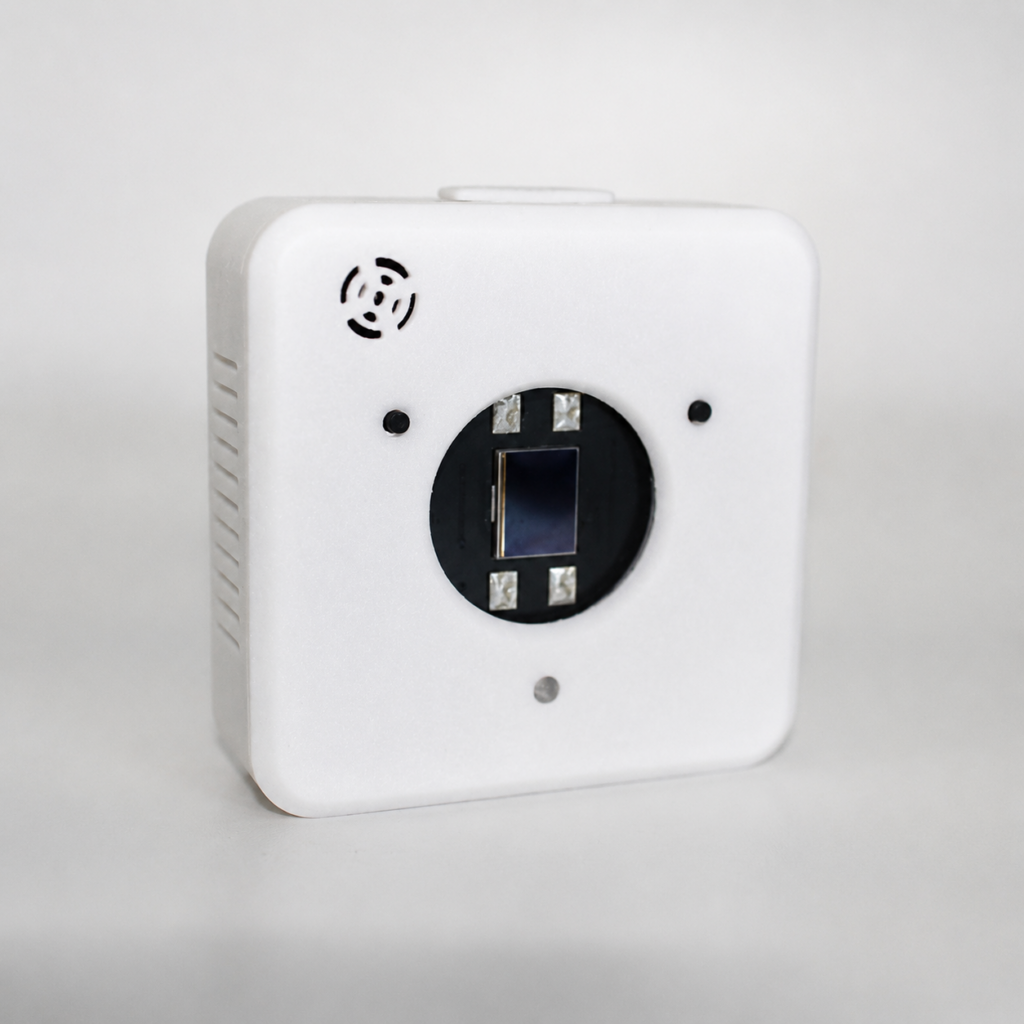
The 4EvAirSense captures important environmental data, including carbon dioxide (CO₂), temperature, humidity and light levels. It gives organisations greater visibility of conditions across their buildings, helping them identify spaces that may be uncomfortable, poorly ventilated or operating inefficiently.
4EvAirSense is powered by our world record-breaking photovoltaic cell technology. Our PV cell is six times more efficient than other cells on the market and can operate in indoor light levels below 100 lux.
With a PV lifetime in the decade’s maintenance costs are non-existent.
This low-light performance makes the device well suited to indoor environments where natural light may be limited.
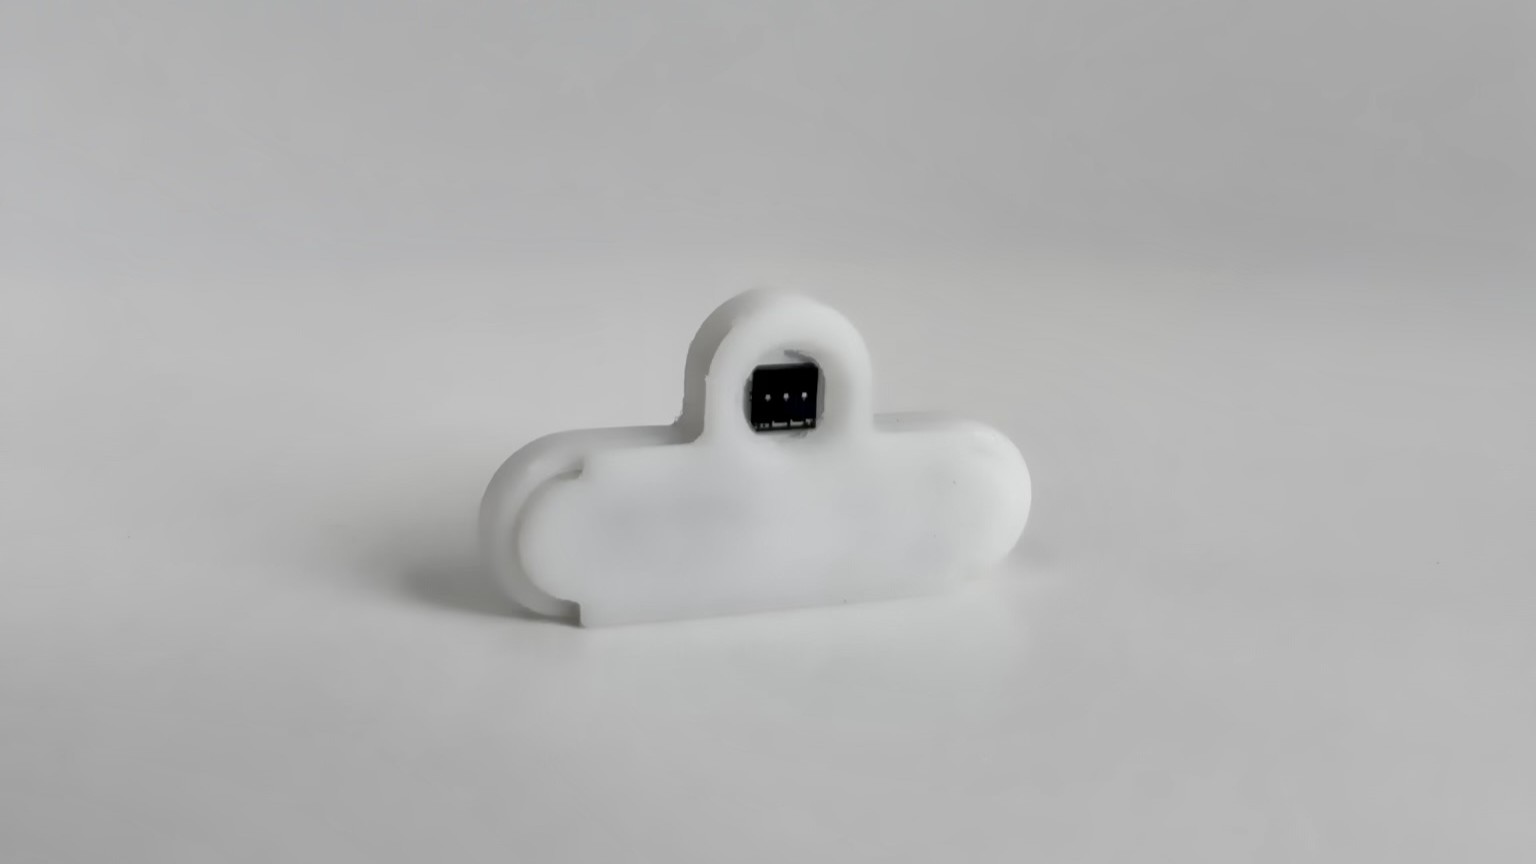
With the miniaturised device measuring less than 10cm², the 4EvAirSense has been designed to make installation simple and unobtrusive. Its lightweight construction means it can be mounted using double-sided tape, avoiding complex installation work and minimising disruption.
Short and long-range versions are available, allowing the solution to be adapted for individual rooms, entire buildings and larger multi-site estates.
The 4EvAirSense monitors the following as standard
- CO₂
- Temperature
- Humidity
- Light Level
Pressure and magnetic-field sensors can also be included where required. We can work with customers to develop additional sensors for specific buildings, equipment or operational challenges.
Lightricity App
Managing data from multiple sensors can be challenging, particularly when information is spread across different systems. The Lightricity app brings all your gathered sensor data together in one convenient location, making it easier to monitor, understand, and act on the information that matters most.
The App presents sensor data in an easy-to-read list format, allowing users to quickly review the latest readings. For a deeper understanding of trends and changes over time, data can also be displayed as interactive graphs.
Users can select custom time periods, making it simple to analyse short term fluctuations or review longer term performance. This flexibility helps businesses identify patterns, monitor conditions, and make more informed decisions based on reliable sensor data.
Lightricity data can be integrated into custom dashboards and Building Management Systems. This enables organisations to incorporate sensor information into their existing workflows and create a centralised view of their operational environment.
Whether you need a straightforward overview or a more advanced monitoring solution, the app can support a range of applications and requirements.
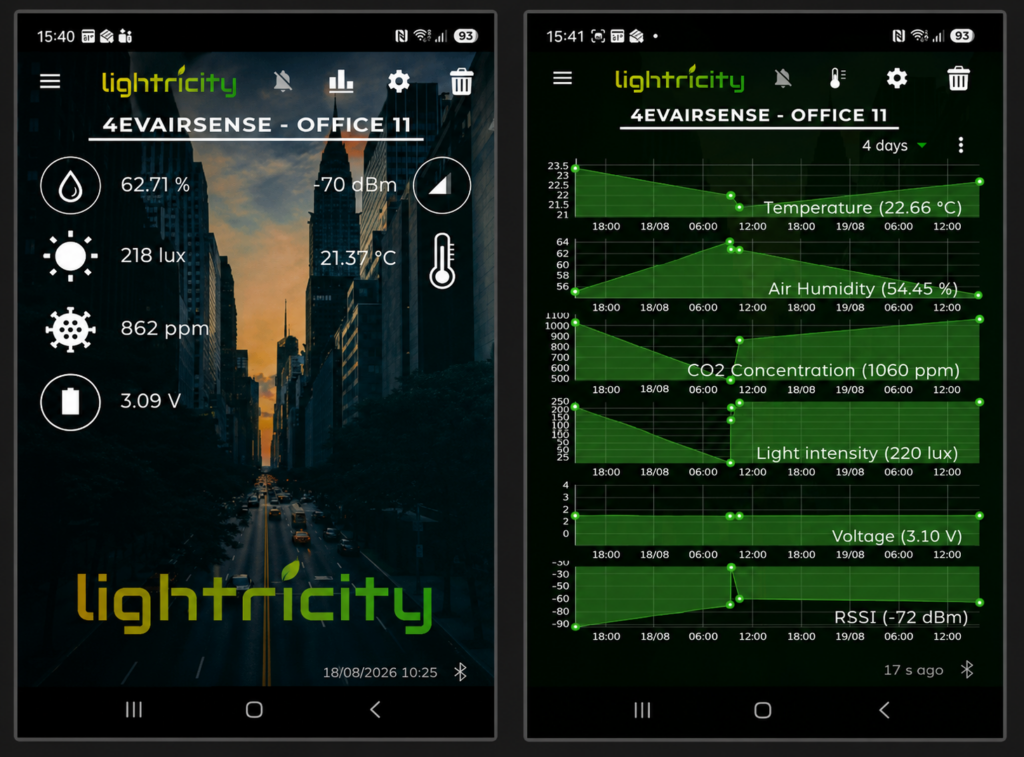
The Lightricity app includes a range of features deigned to make sensor monitoring more efficient.
- Threshold notifications: Receive alerts when sensor readings meet predefined thresholds.
- List based data viewing: Review sensor readings as clear, structured information.
- Graphical data analysis: View sensor data over time using customisable graphs.
- Beacon status timer: See how long it has been since the last beacon signal was received.
- Full device compatibility: Connect with all Lightricity IoT devices.
- Unit customisation: Configure measurement units to suit your preferences and requirements.
By combining real time monitoring, flexible data visualisation, notifications and integration capabilities, the Lightricity app provides practical solution for managing IoT sensor data.
It gives users the information they need in a clear and accessible format, helping them monitor conditions more effectively and act when required.